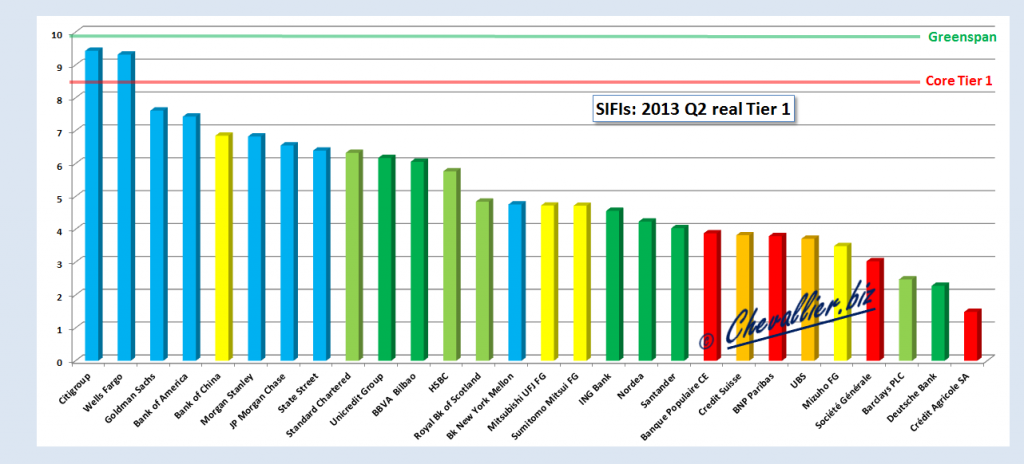
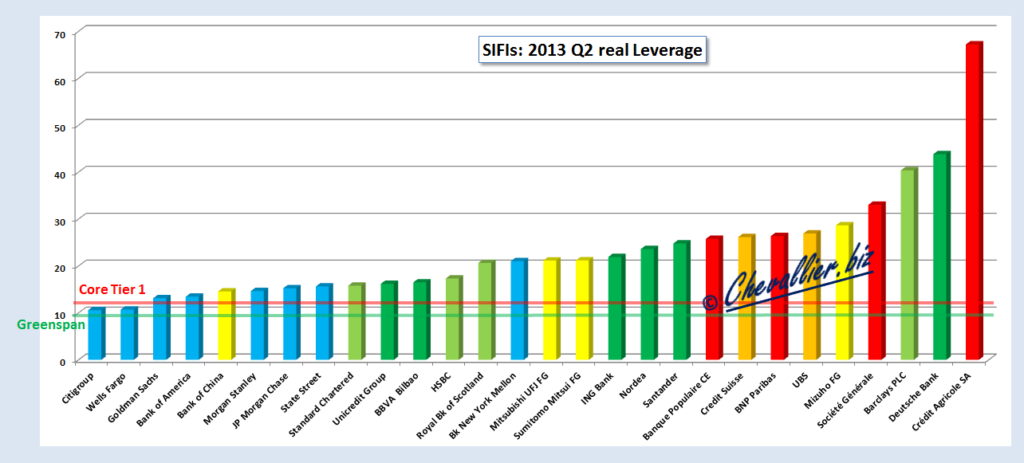
Like all companies, banks finance their assets by equity and liabilities. Alan Grenspan enacted in the 80’s Tier 1 ratio Rule for the banking system: the amount of capital must be greater than 8% of the total debt, its inverse is the leverage to be less than 12.5.
After the financial turmoil he increased this ratio to 10%, i.e. a leverage of up to 10.
After the bursting of the Internet bubble, Alan Grenspan dictated to companies to recognize any goodwill in losses and in full instead of amortizing it over 20 years, which restored fundamentals and GDP growth.
These two rules must be applied to determine the current real leverage of real capital: tangible assets (excluding minority interests).
Table of real leverage ratio and Tier 1 for 28 Systemically Important Financial Institutions (SIFIs),
Document 1:
None of these major banks respects the rules of a real Tier 1 ratio above 10% but U.S. banks are those that are closest, Citigroup and Wells Fargo are the most reliable,
Document 2:

Banks in the United States in blue, French Gos banks in red, Switzerland’s banks in orange, banks under Bank Of England in light green, other European bank in dark green s, Asian banks in… yellow.
The graph shows that European banks leverage is the most dangerous, especially Crédit Agricole (CASA) and Deutsche Bank,
Document 3:

Major European banks do not follow the rules of prudential borrowing. The interbank market in the euro zone does not work. The ECB has to replace the market to avoid a banking tsunami that threatens the world.
| Rank | Banks 2013 Q2 | Liabilities | Tangible equity | Leverage | Core Tier 1 |
|---|---|---|---|---|---|
| 1 | Citigroup | 1 721,61 | 162,382 | 10,6 | 9,4 |
| 2 | Wells Fargo | 1 317,77 | 122,796 | 10,7 | 9,3 |
| 3 | Goldman Sachs | 871,651 | 66,349 | 13,1 | 7,6 |
| 4 | Bank of America | 1 976,46 | 146,861 | 13,5 | 7,4 |
| 5 | Bank of China | 12 406,23 | 849,978 | 14,6 | 6,9 |
| 6 | Morgan Stanley | 754,178 | 146,861 | 14,7 | 6,8 |
| 7 | JP Morgan Chase | 2 289,77 | 149,977 | 15,3 | 6,5 |
| 8 | State Street | 213,633 | 13,667 | 15,6 | 6,4 |
| 9 | Standard Chartered | 611,289 | 38,668 | 15,8 | 6,3 |
| 10 | Unicredit Group | 837,918 | 51,714 | 16,2 | 6,2 |
| 11 | BBVA Bilbao | 583,177 | 35,326 | 16,5 | 6,1 |
| 12 | HSBC | 2 501,10 | 144,217 | 17,3 | 5,8 |
| 13 | Royal Bk of Scotland | 1 160,05 | 56,183 | 20,6 | 4,84 |
| 14 | Bk New York Mellon | 343,486 | 16,336 | 21 | 4,76 |
| 15 | Mitsubishi UFJ FG | 223 921 | 10 578 | 21,2 | 4,724 |
| 16 | Sumitomo Mitsui FG | 140 069 | 6 608 | 21,2 | 4,718 |
| 17 | ING Bank | 1 093,72 | 49,881 | 21,9 | 4,6 |
| 18 | Nordea | 596,629 | 25,267 | 23,6 | 4,2 |
| 19 | Santander | 1 175,70 | 47,421 | 24,79 | 4 |
| 20 | Banque Populaire CE | 1 647,67 | 63,923 | 25,8 | 3,9 |
| 21 | Credit Suisse | 886,055 | 33,848 | 26,2 | 3,82 |
| 22 | BNP Paribas | 1 837,63 | 69,657 | 26,4 | 3,79 |
| 23 | UBS | 1 088,65 | 40,426 | 26,9 | 3,7 |
| 24 | Mizuho FG | 168 803,10 | 5 889,71 | 28,7 | 3,5 |
| 25 | Société Générale | 1 209,68 | 36,618 | 33 | 3 |
| 26 | Barclays PLC | 1 495,70 | 37,034 | 40,4 | 2,5 |
| 27 | Deutsche Bank | 1 867,29 | 42,592 | 43,8 | 2,3 |
| 28 | Crédit Agricole SA | 1 758,74 | 26,164 | 67,2 | 1,5 |


